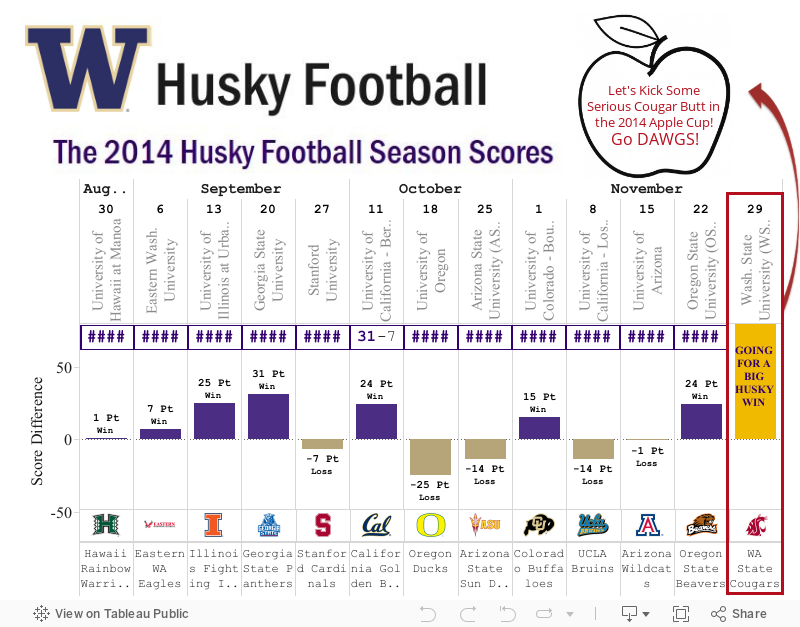
I am officially entering the world of blogging. Over the past year I have fallen in love with data visualization working on both public and internal visualizations for my employer PayScale.com. I started working at PayScale one year ago as a data analyst, proceeded to buy a very large book on Excel from Barnes and Noble, and dove into the world of traditional data analytics. However, my role at the company slowly began to shift as I was introduced to Tableau and began focusing much of my work on data visualization and storytelling with data. I began working not only with our data team but also with our consumer marketing department an increasing amount as my visualization skills improved to help create interactive Tableau visualizations for our data packages found on our website. My first introduction to Tableau was as the analyst on a PR package that calculates the "Best Jobs for You" (Best Jobs Package). I was immediately impressed with the software and wanted to learn more. I continued to help with visualizations (Compensation Best Practices Report) and in March I was given the opportunity to create an entire set of visualizations for the College Return on Investment Package (ROI Package) of which six were finalized and published on Payscale.com. We continued to produce visualizations including Putting CEO Pay in Perspective, College Salary Report Best Majors and Most Meaningful Jobs which landed over 275,000 views and was awarded the Tableau Viz of the Day on August 5th. I am also using Tableau for my internal analytics nearly 50 percent of the time at this point. As I have been consumed with transforming static data into compelling visualizations for much of the year, I now want to visualize almost everything I see and therefore have decided to start a blog and do just that. I thought I would kick it off with a simple viz about the UW Husky football season as we have the Apple Cup this evening!